1.2. KoraBeam
1.2.1. Mechanical Interface
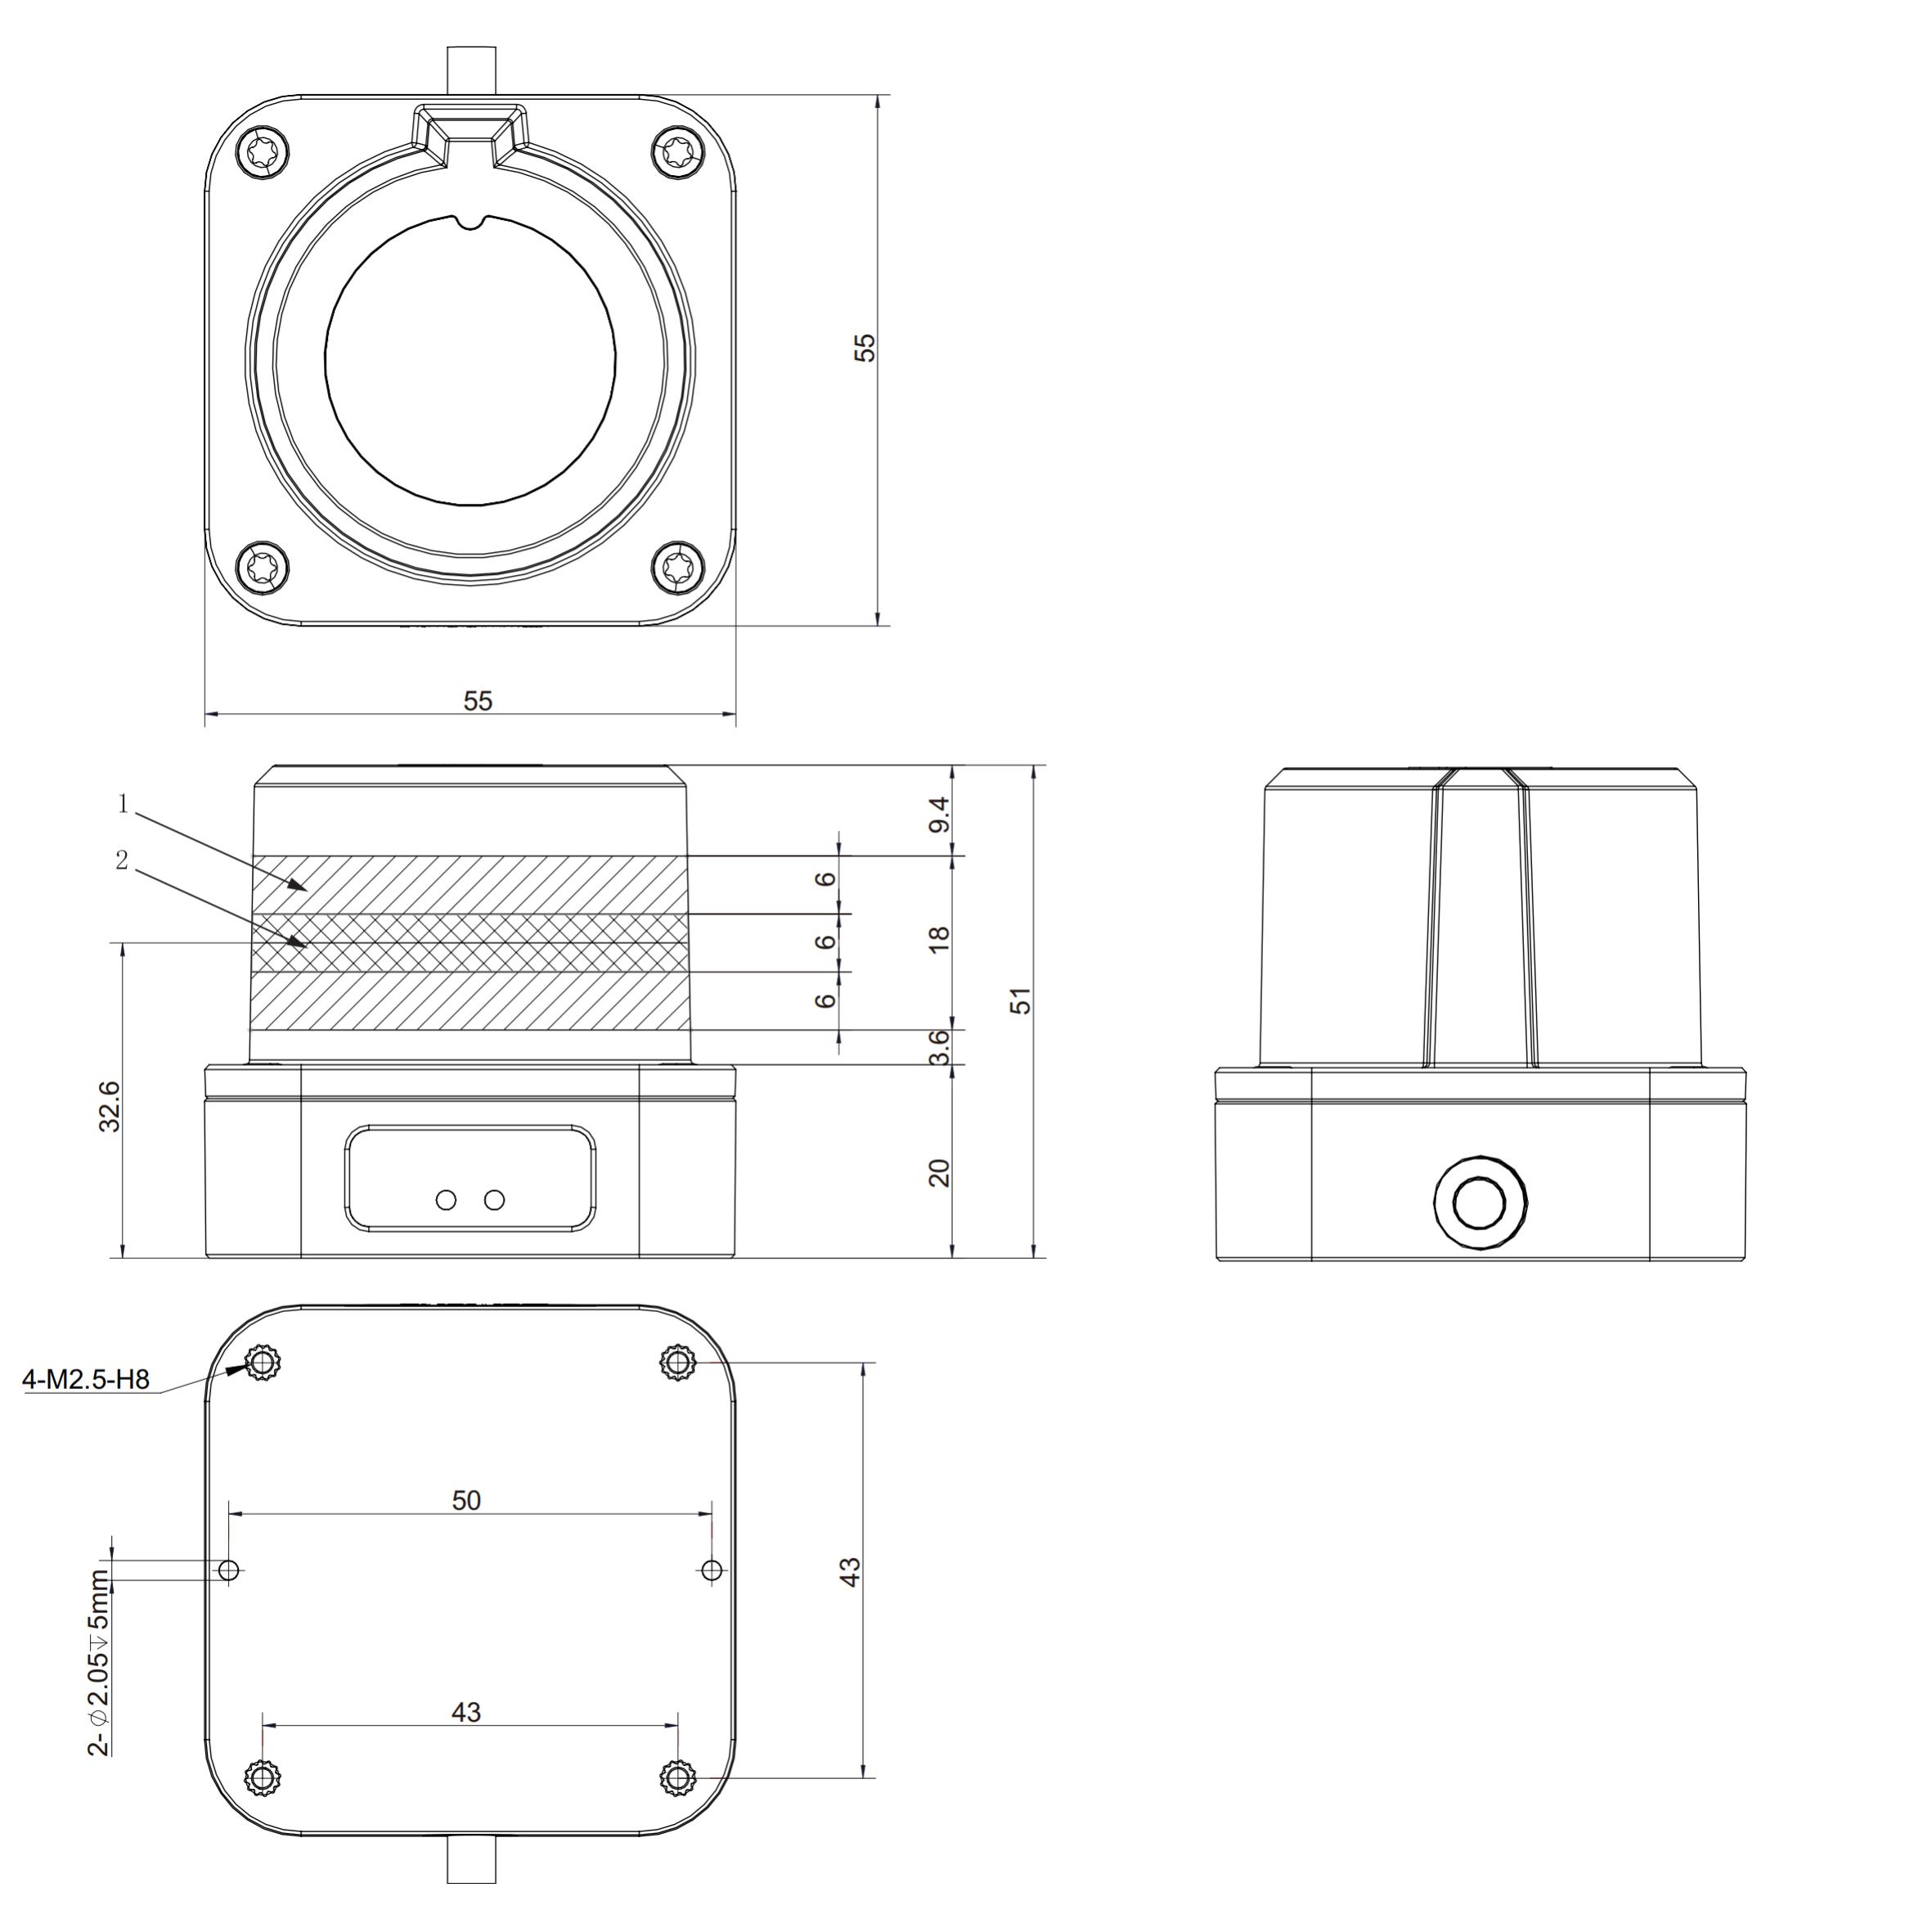
Please install the KoraBeam according to the dimensions and mounting hole positions shown in the image below, ensuring it is positioned appropriately.
1.2.2. Establish Connection
1.2.2.1. Cable Definition
The specific connection definitions for the cable interfaces of the KoraBeam product family are as follows.:
Wire Color |
Signal |
Function |
|---|---|---|
Red |
Sensor SupplyVoltage |
Supply Voltage(9∼36V) |
Black |
GND |
Ground |
Yellow |
RS485A |
RS485A/RS232TX |
White |
RS485B |
RS485B/RS232RX |
Purple |
Common |
COM+ |
Orange |
Input |
IN1 |
Green |
Input |
IN2 |
Blue |
Input |
IN3 |
Brown |
Input |
IN4 |
Gray |
Common |
COM- |
White and Orange |
Output |
OUT1 |
White and Green |
Output |
OUT2 |
White and Blue |
Output |
OUT3 |
White and Brown |
Output |
OUT4 |
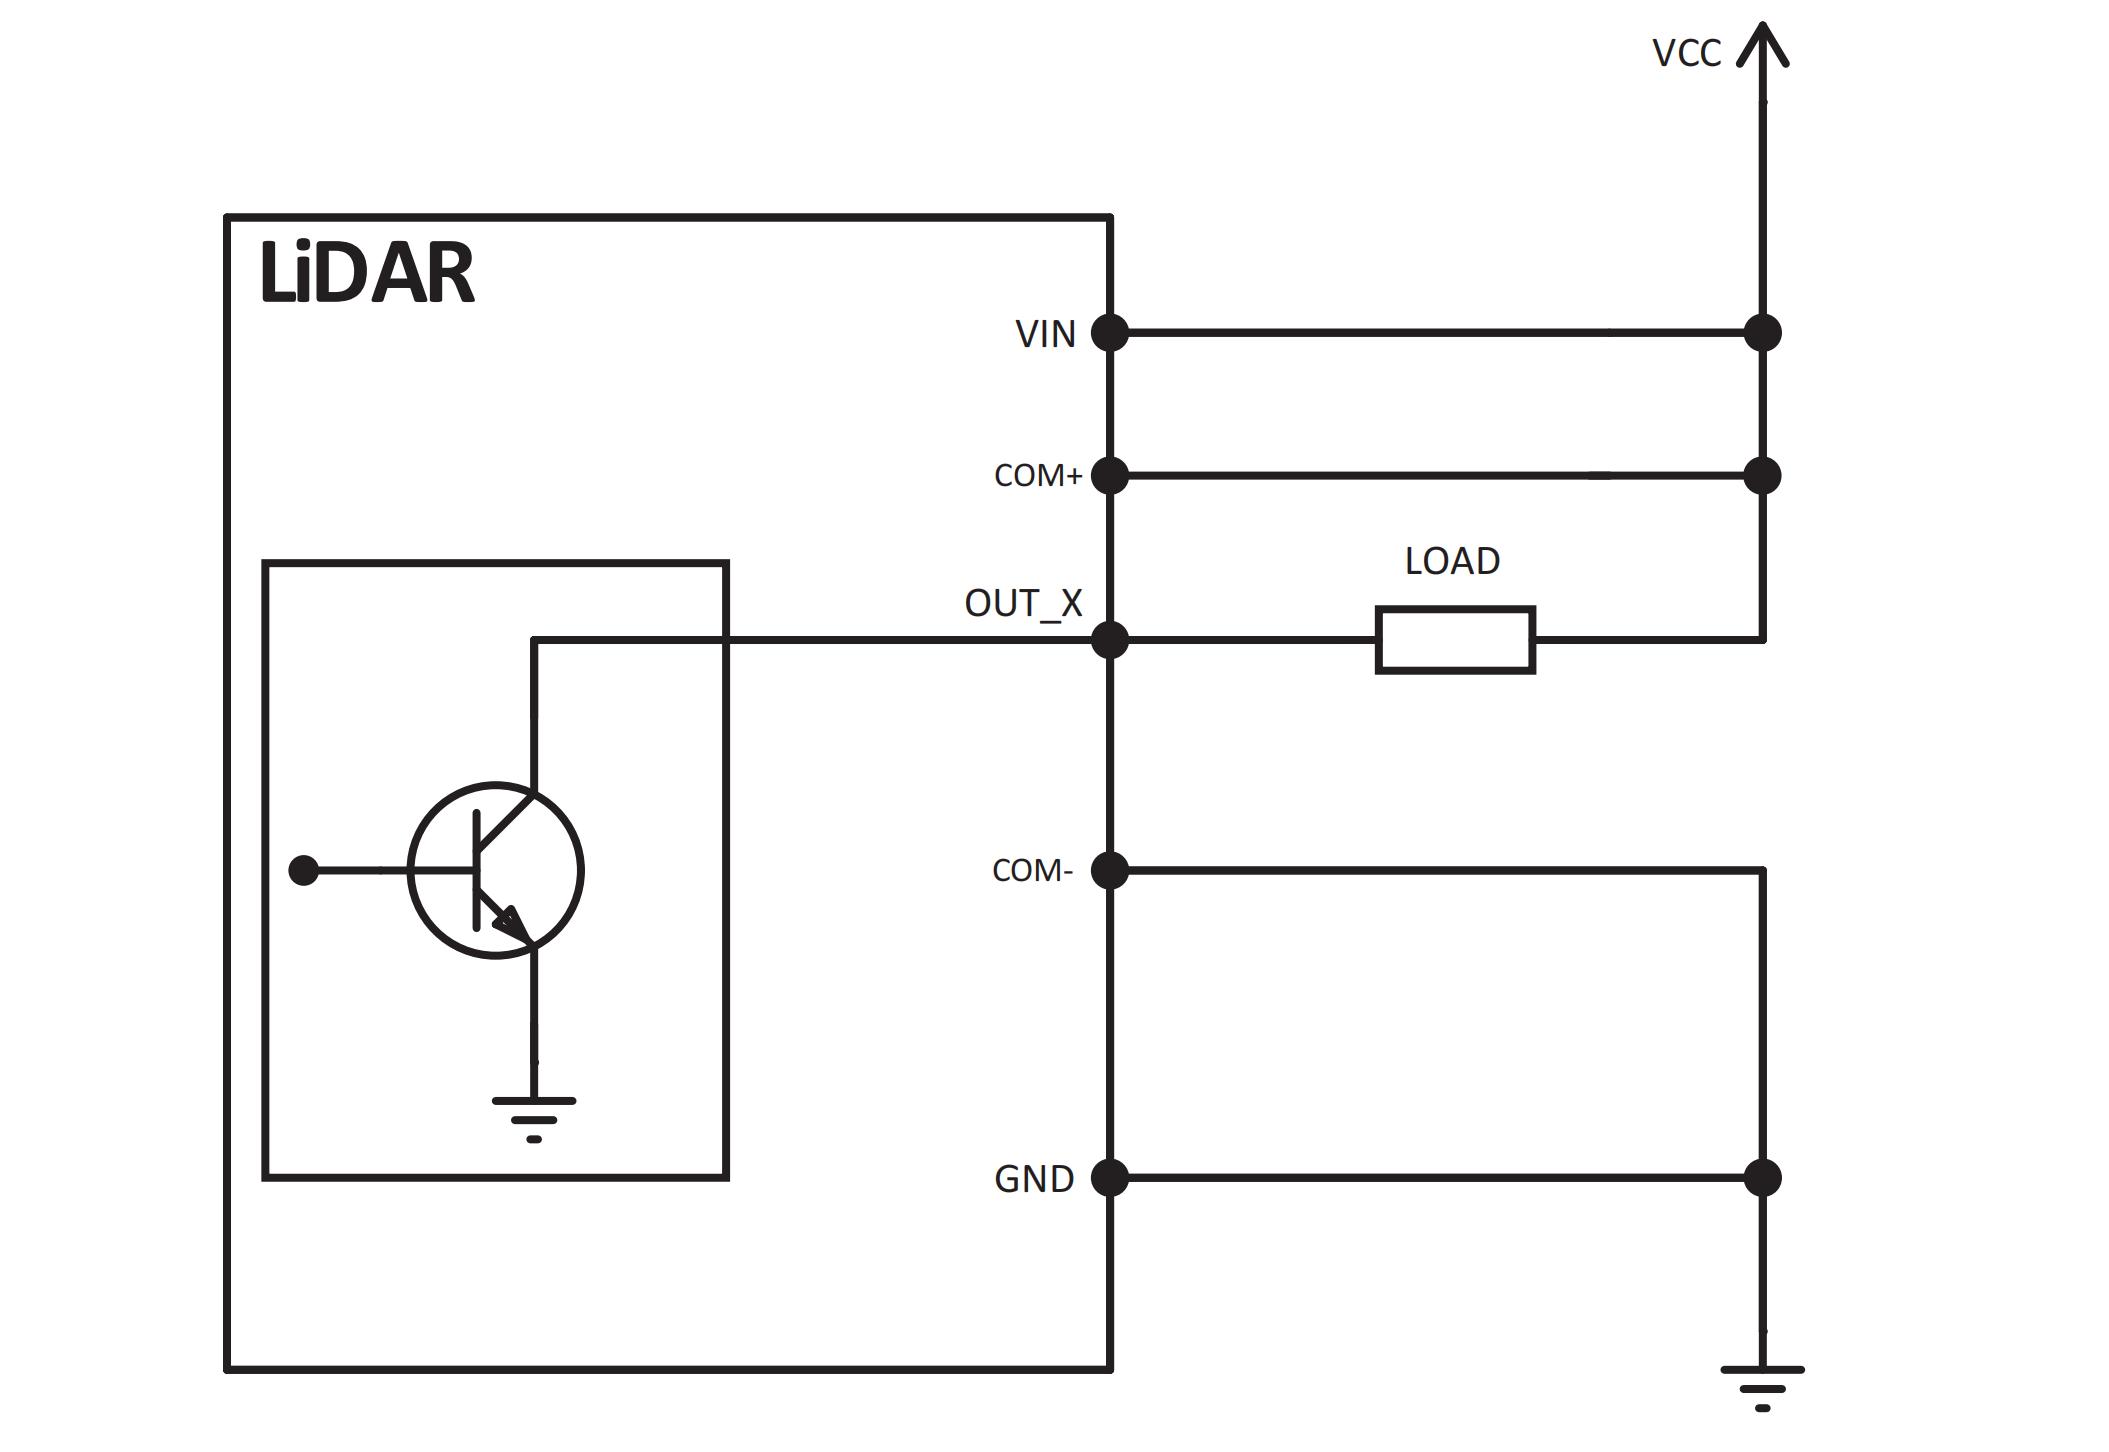
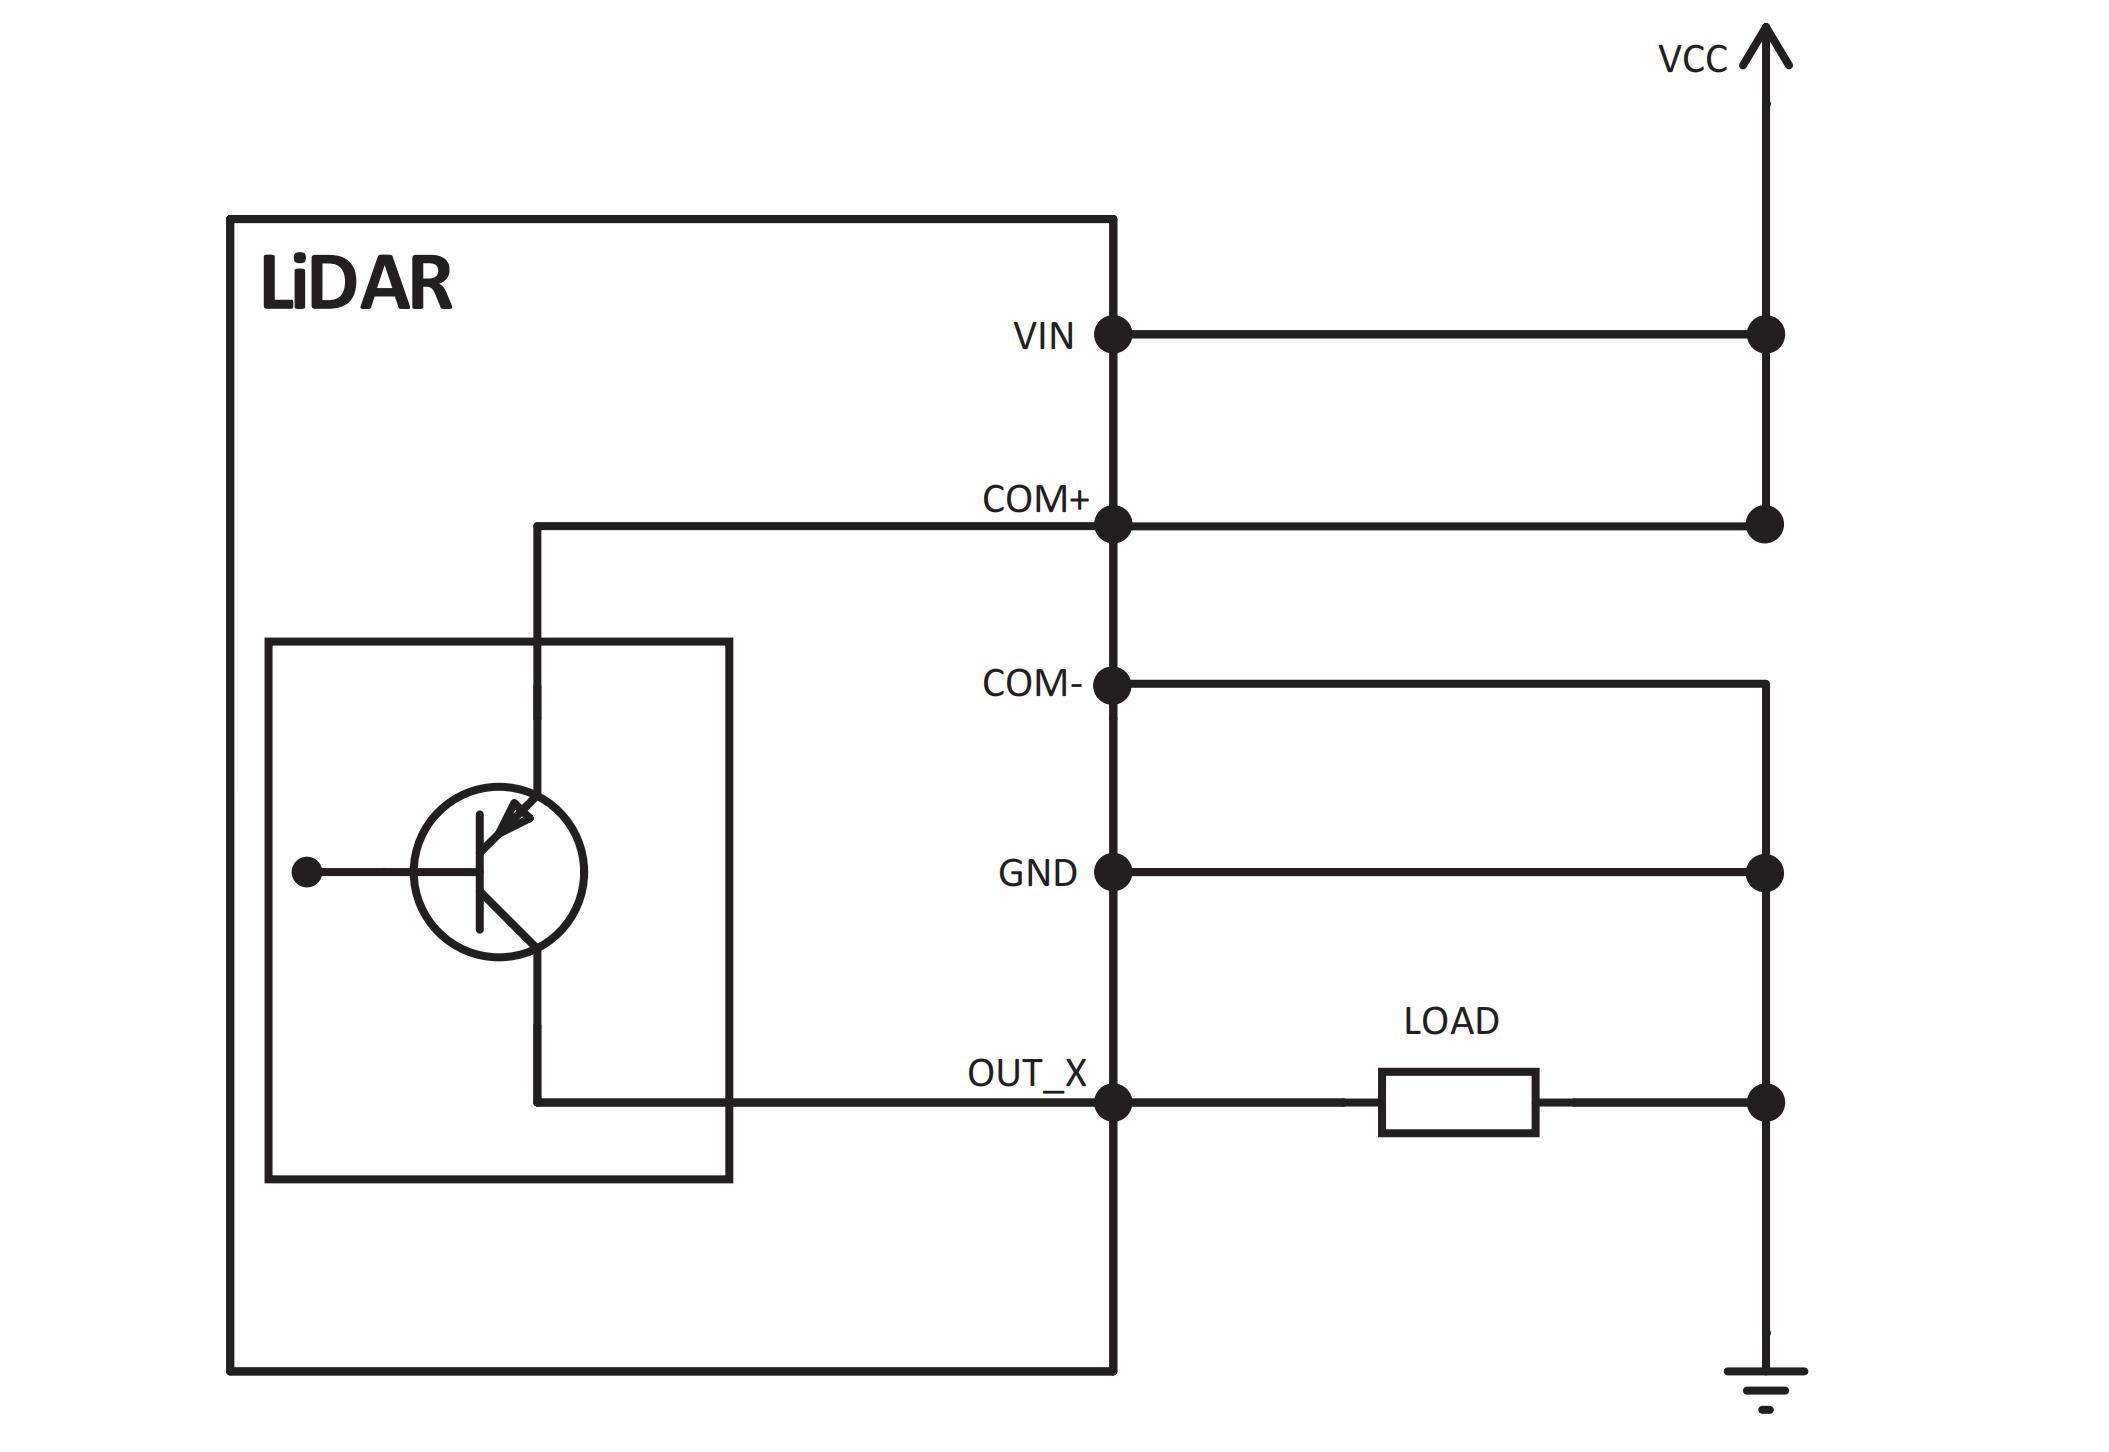
1.2.2.2. Wiring of Digital Output
NPN
PNP
1.2.2.3. Download and Install RBScan
Click on the official website link to enter the official website of Richbeam, where you can download the latest RBScan , view the point cloud, and configure the monitored areas.
RBScan currently supports Windows ® Version 10 and above.
Download the RBScan file.
Double-click on RBScan.exe to begin using it.
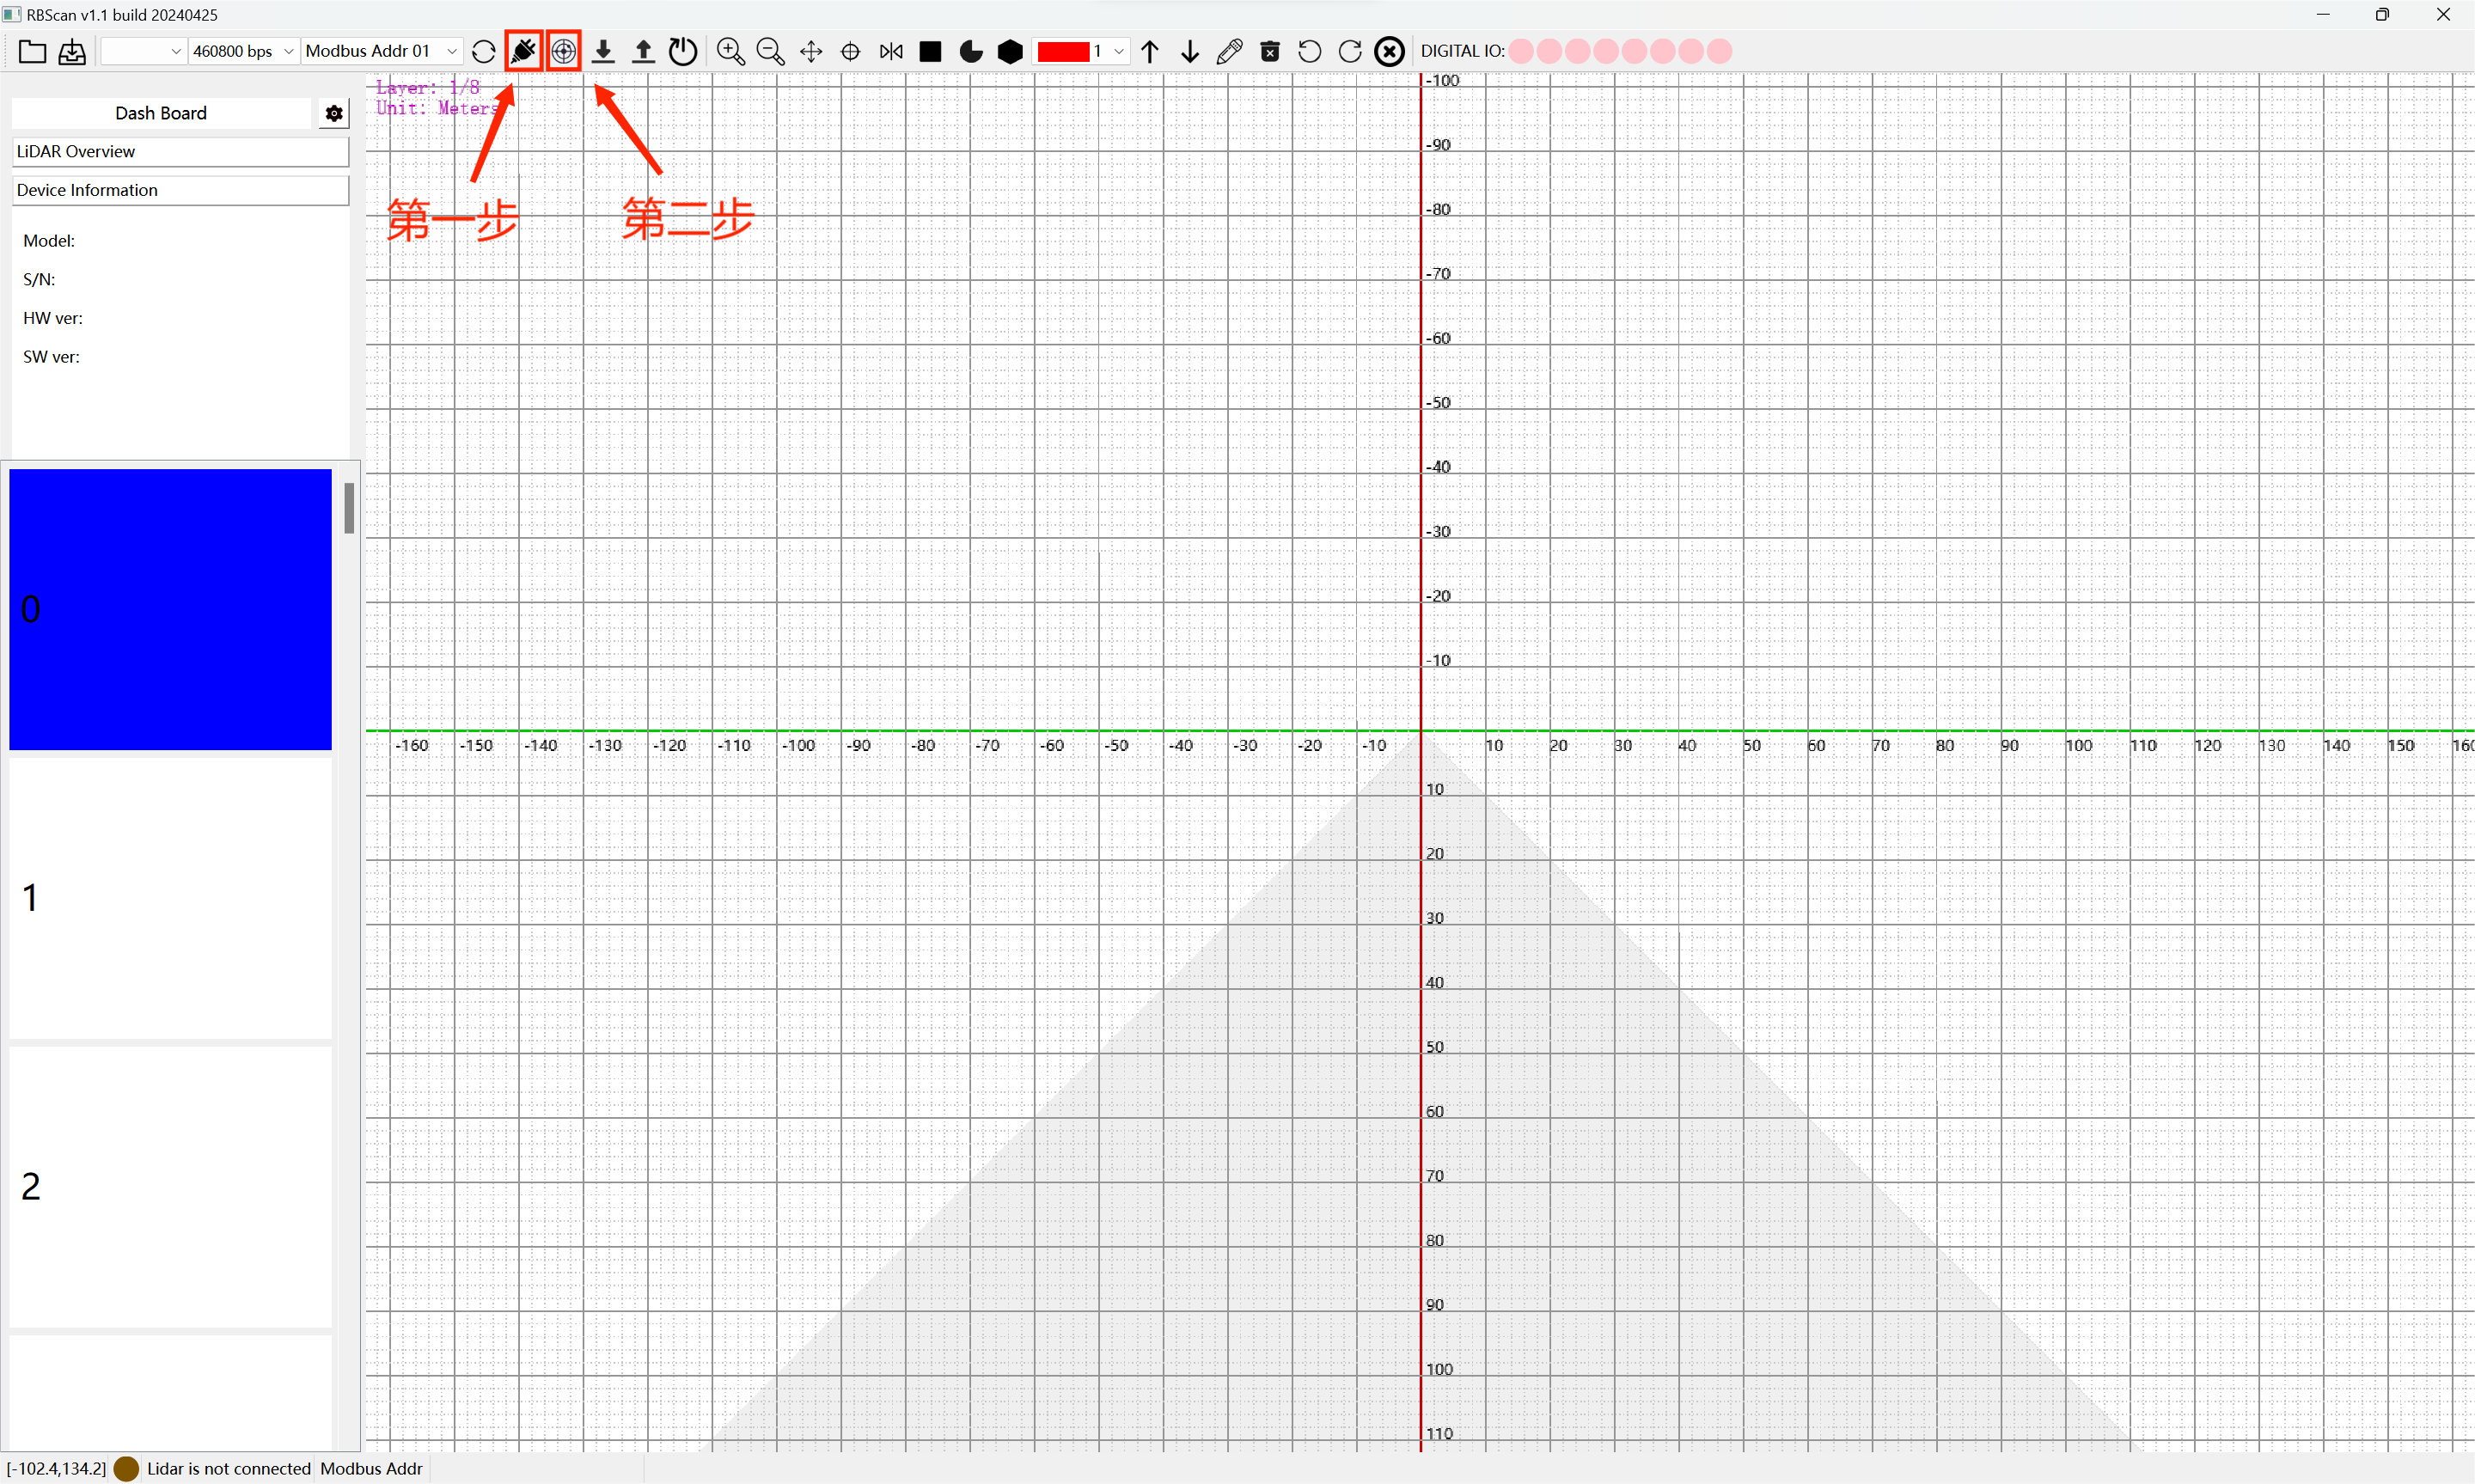
Select the corresponding Lidar port number and baud rate (default is 460800).
Click the “Open port” button, then click the “Scan Lidar” button on the right to connect the Lidar.
1.2.2.4. Configure the obstacle avoidance area.
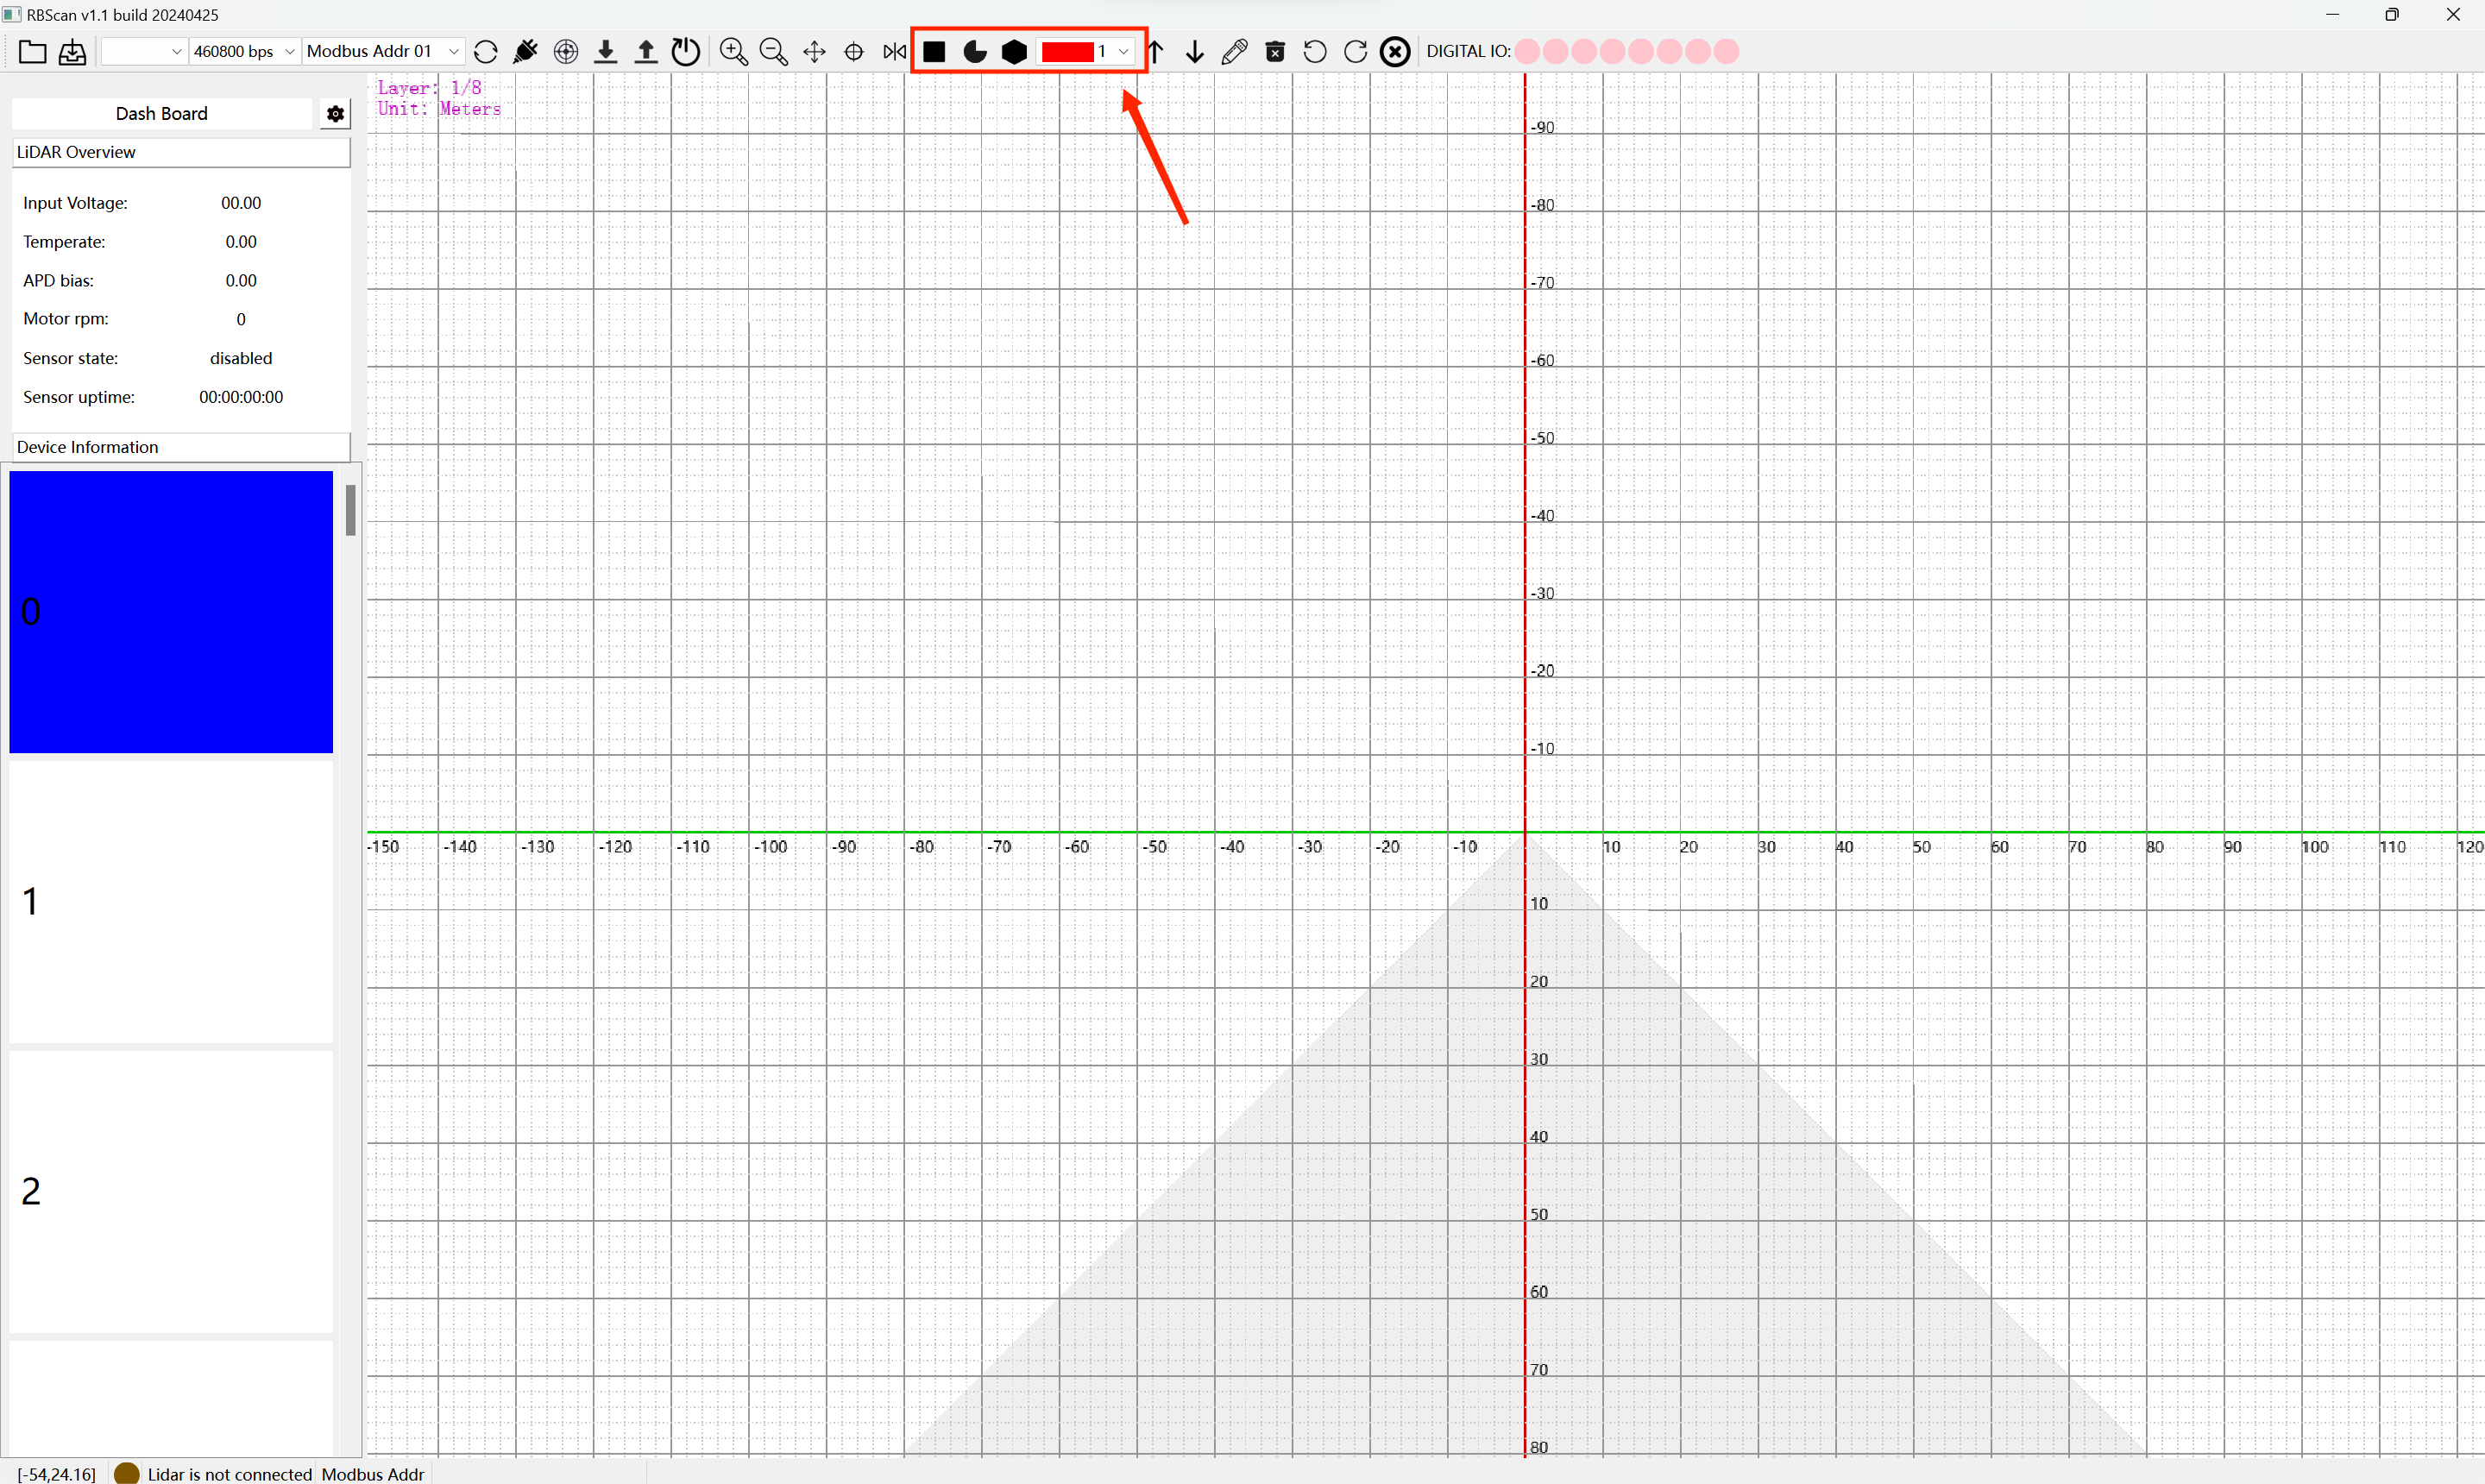
Select the rectangle, sector, or polygon icon to draw the obstacle avoidance area. (When configuring multiple obstacle avoidance areas for the first time, manually modify the output signal corresponding to each obstacle area.)
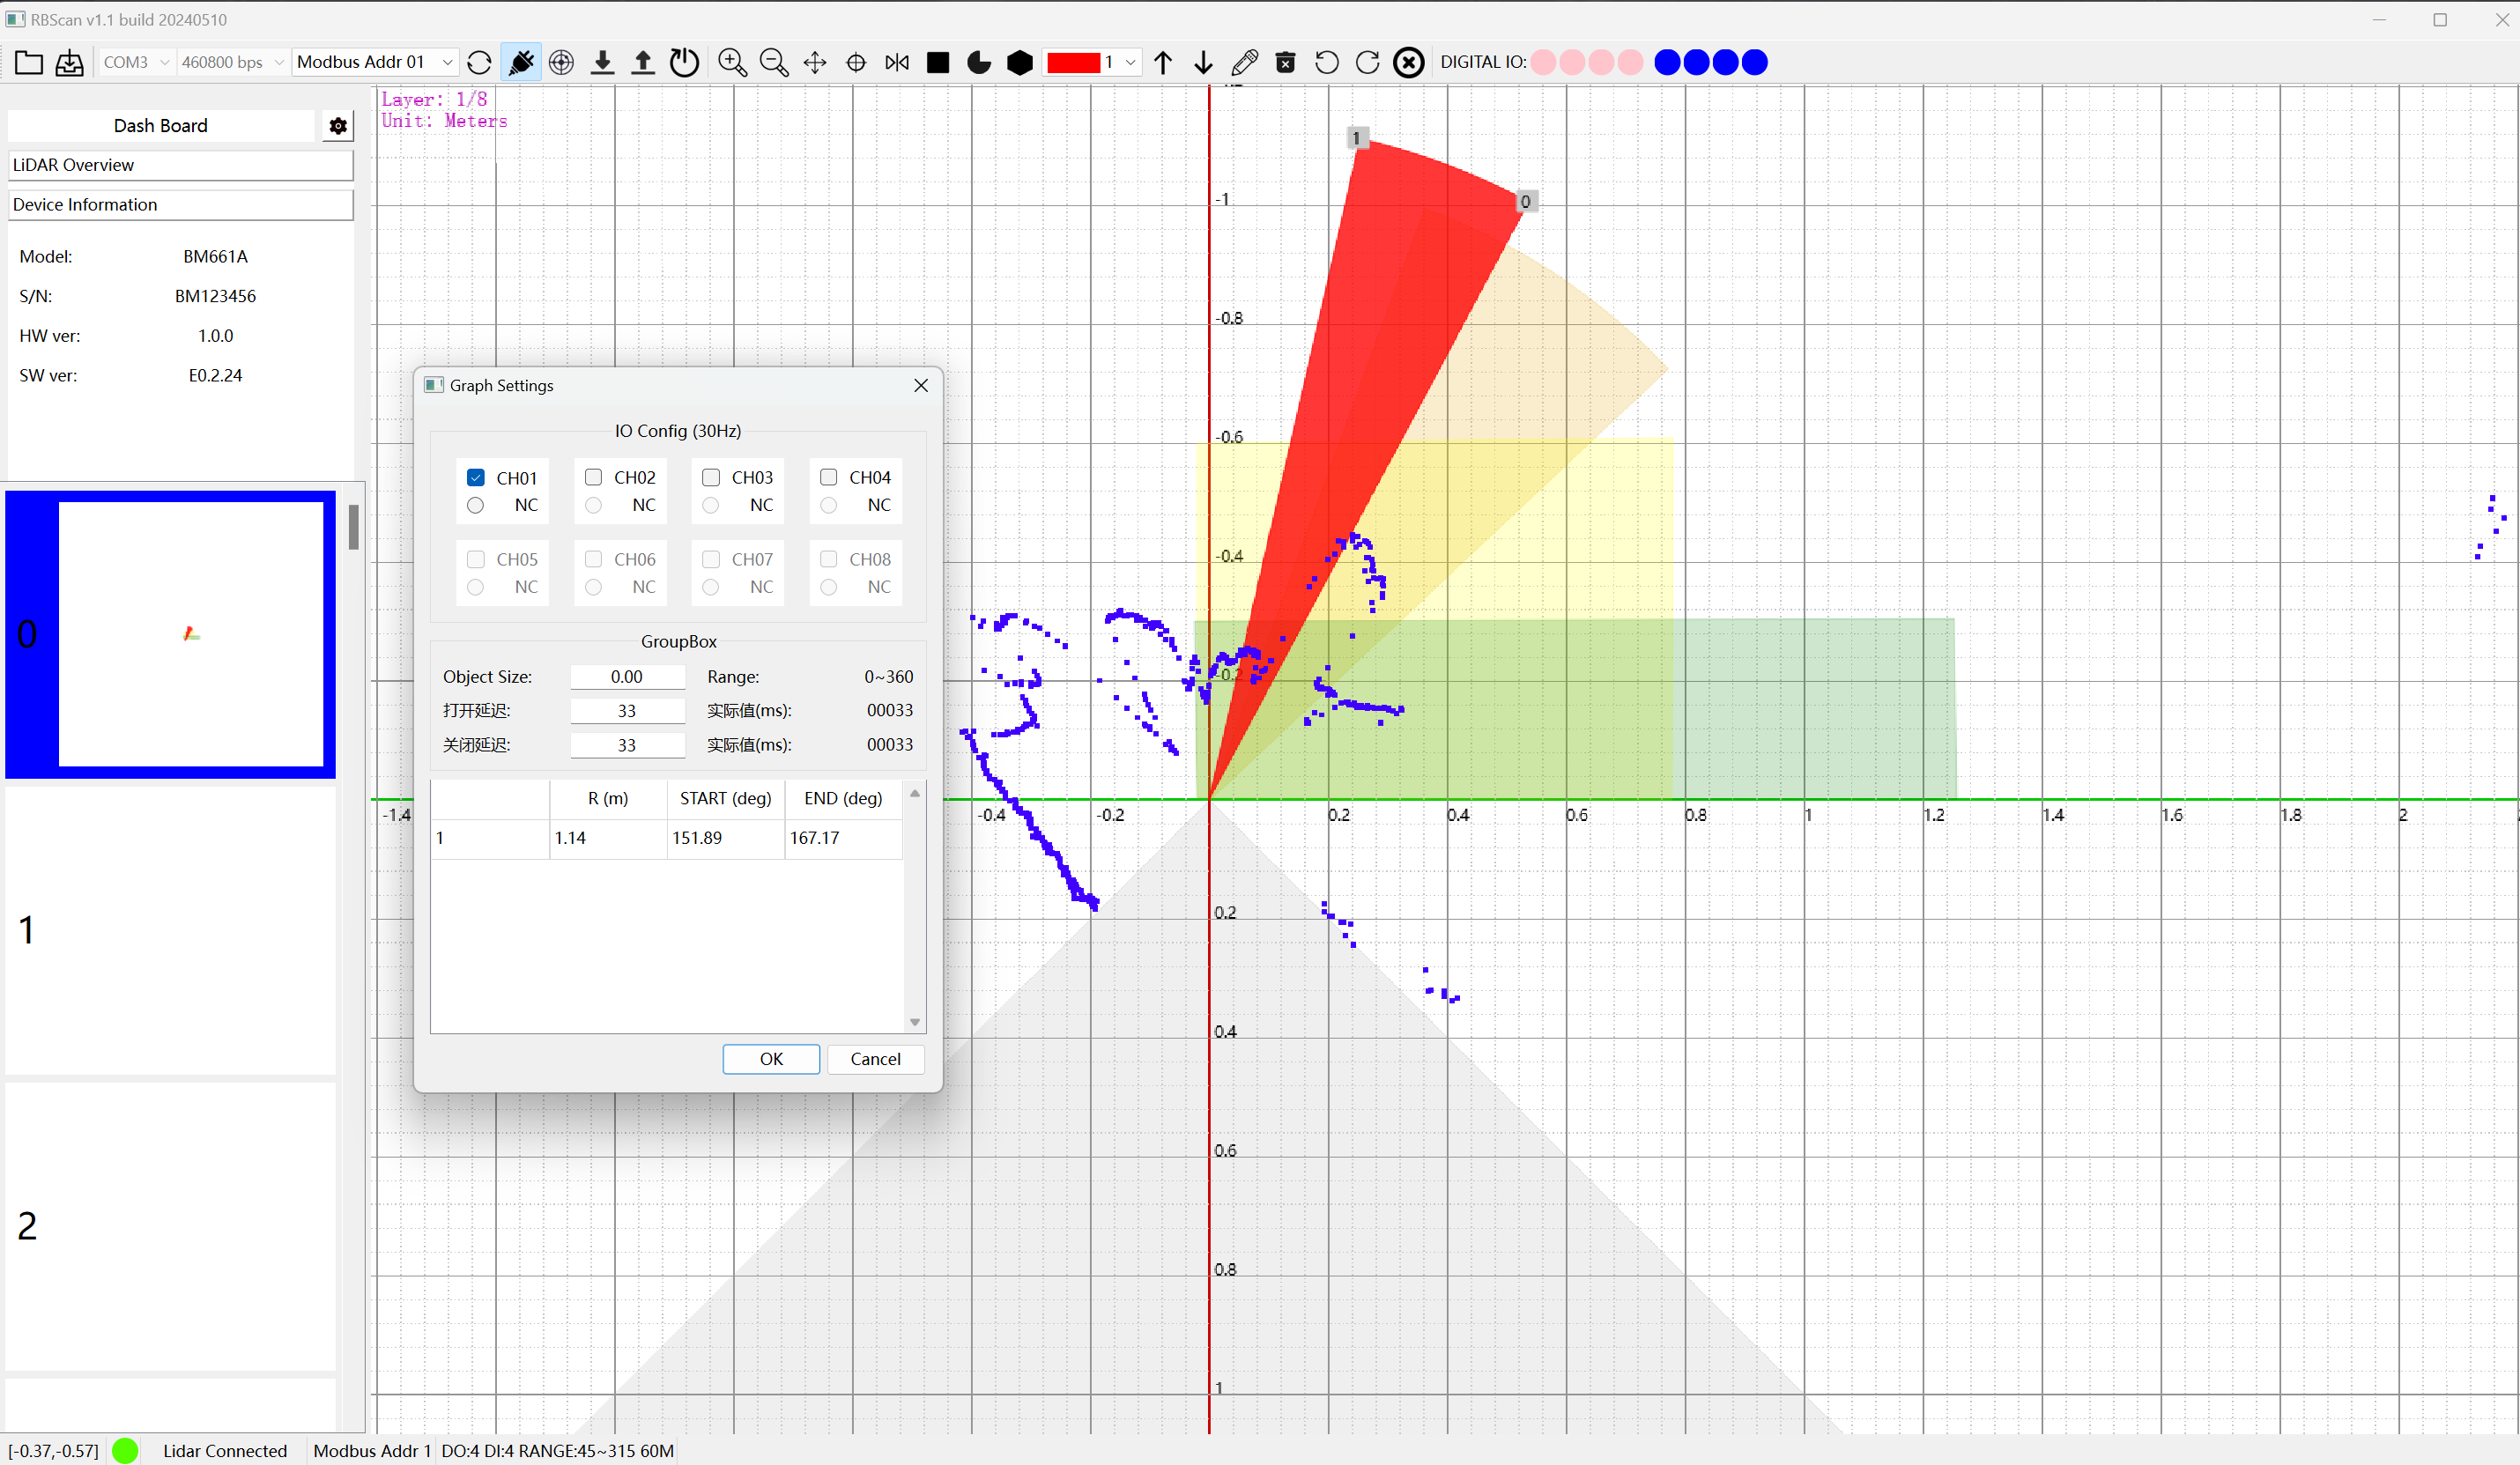
Double-click on the canvas with the left mouse button to open the Graph Setting window. In this window, adjust the IO output and output mode (Normally Open/Normally Closed) for the current obstacle avoidance area. In the lower part of the Graph Setting window, you can adjust the X and Y coordinates of the boundary points of the obstacle area, as well as the corresponding angles. Once the settings are complete, click OK to exit.
Click “Upload” to upload the configuration information to the Lidar. Select “Set” to restart the Lidar (this process takes approximately 20 seconds). Then, click “Scan Lidar” to refresh and display the point cloud.
